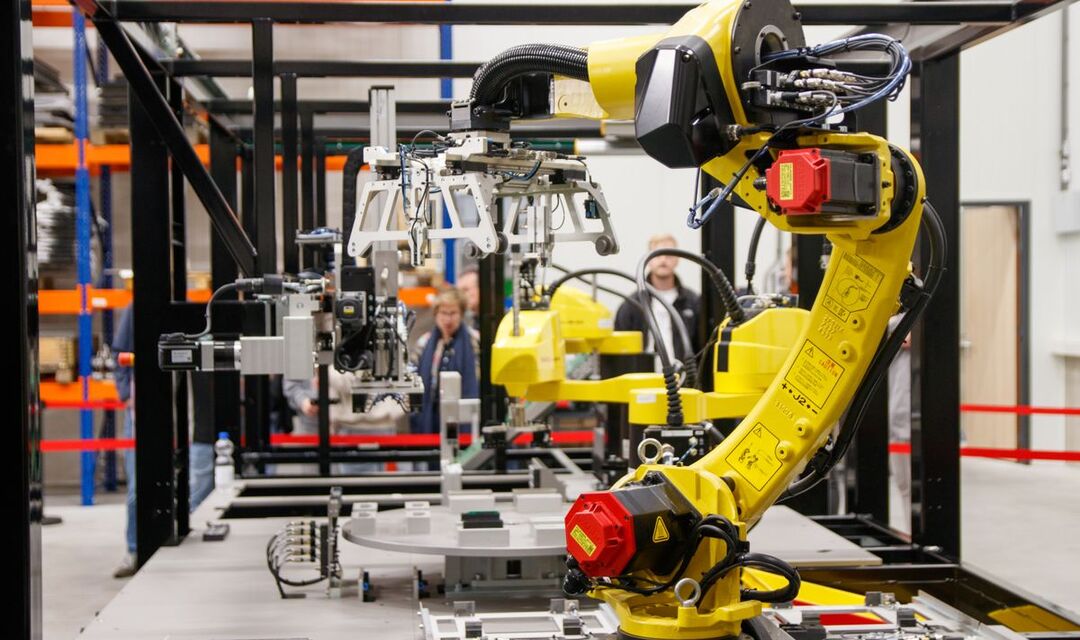
Manufacturing & Industry
PLC/SCADA monitoring, predictive maintenance, visual quality inspection, and production dashboards.
Less downtime, better quality
Most organizations already have the data they need. It is just spread across spreadsheets, databases, and the systems your teams use every day. Green Olive Tech brings it together and builds the dashboards, forecasts, and automations that help your people spend less time chasing numbers and more time acting on them.
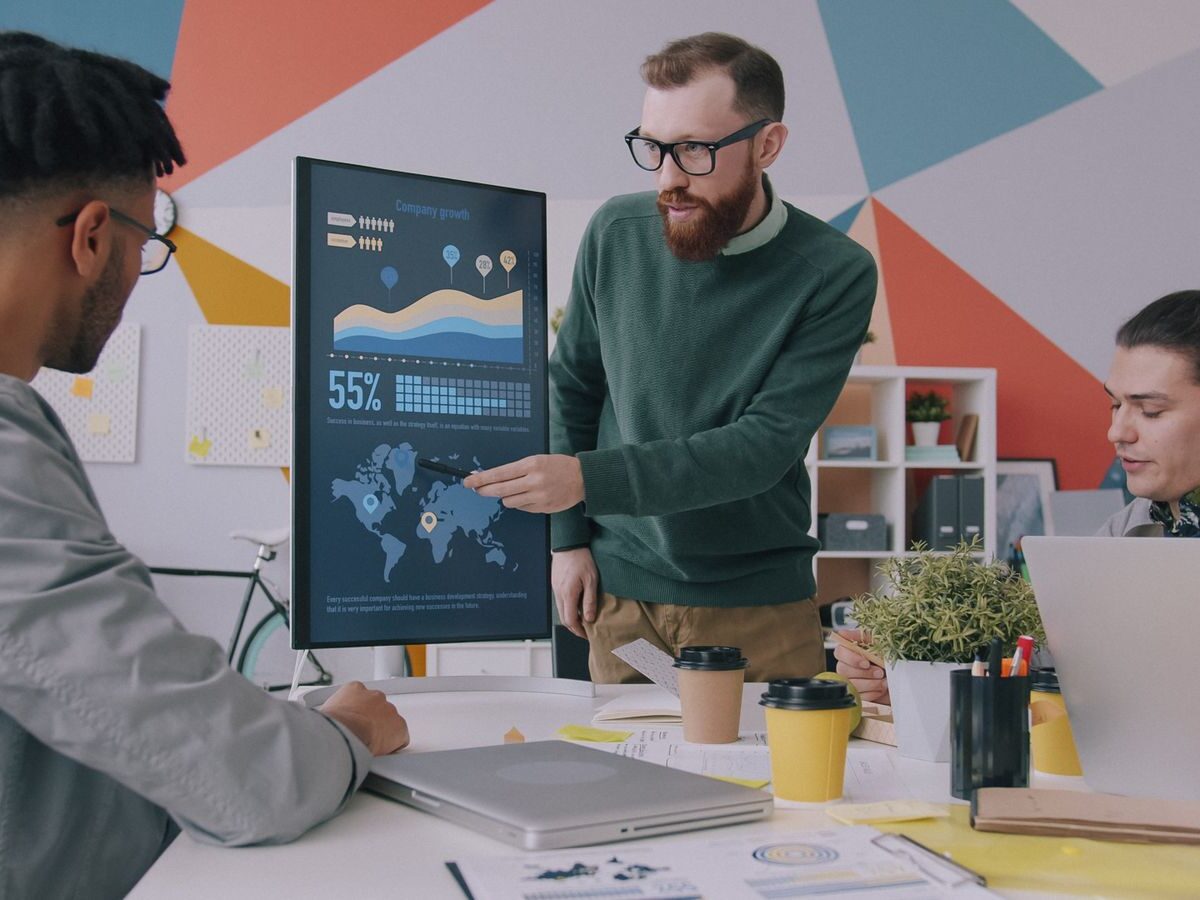
Green Olive Tech is a Baltimore-based AI technology and engineering solutions company. Our team brings a combined 25 years of industry experience across education, commercial, and other industries.
Our AI solutions are built on a strong foundation of software engineering, data engineering, and analytics: the disciplines that make AI reliable in production. Sound engineering principles, well-modeled data, and dependable pipelines come first, and the intelligence is built on top. Today, our mission is to bring that foundation into practical, customized solutions for manufacturing, business, security, and service organizations.
We bridge the gap between advanced AI and real-world industry.
From a focused application to a connected enterprise platform, we engineer tools around your existing systems, data, workflows, and objectives.
Purpose-built models and applications for classification, forecasting, anomaly detection, and decision support.
AI-assisted video and image analysis for inspection, monitoring, process validation, and security.
Unified operational views that combine live KPIs, historical trends, intelligent alerts, and predictive insights.
Turn PLC, SCADA, sensor, and equipment data into useful maintenance and production intelligence.
Automate reporting, document analysis, knowledge workflows, and repetitive business processes.
Connect databases, enterprise systems, IoT networks, APIs, and security platforms into tailored solutions.
See the platforms we deliver with on our Technology page →
Our solutions target practical improvements that matter to business leaders, operators, engineers, and their customers.
Reduce repetitive effort, bottlenecks, and avoidable interruptions.
Monitor defects, consistency, inspection findings, and audit readiness.
Detect patterns and emerging risks that conventional reports may miss.
Discover waste, downtime, and resource utilization opportunities.
Unify event monitoring and help prioritize critical incidents.
Bring fragmented information into timely, useful management views.
Different industries need different products. These are examples of customized applications and dashboards we can develop.
PLC/SCADA monitoring, predictive maintenance, visual quality inspection, and production dashboards.
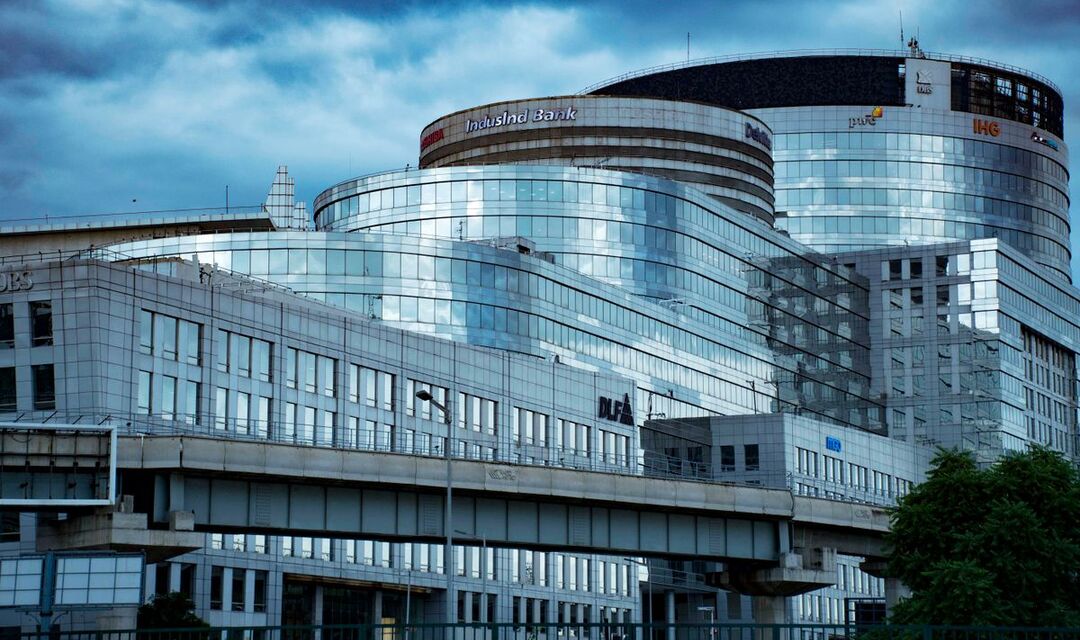
Transaction anomaly analysis, risk dashboards, claims document intelligence, and operational monitoring.
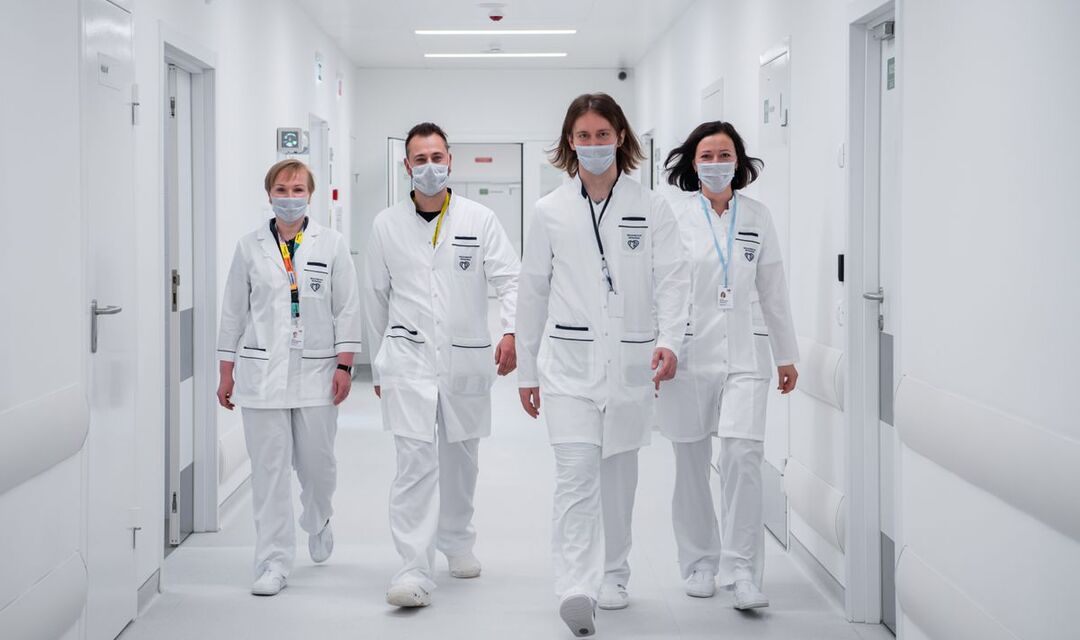
Patient-flow analytics, equipment visibility, facility monitoring, and resource management dashboards.
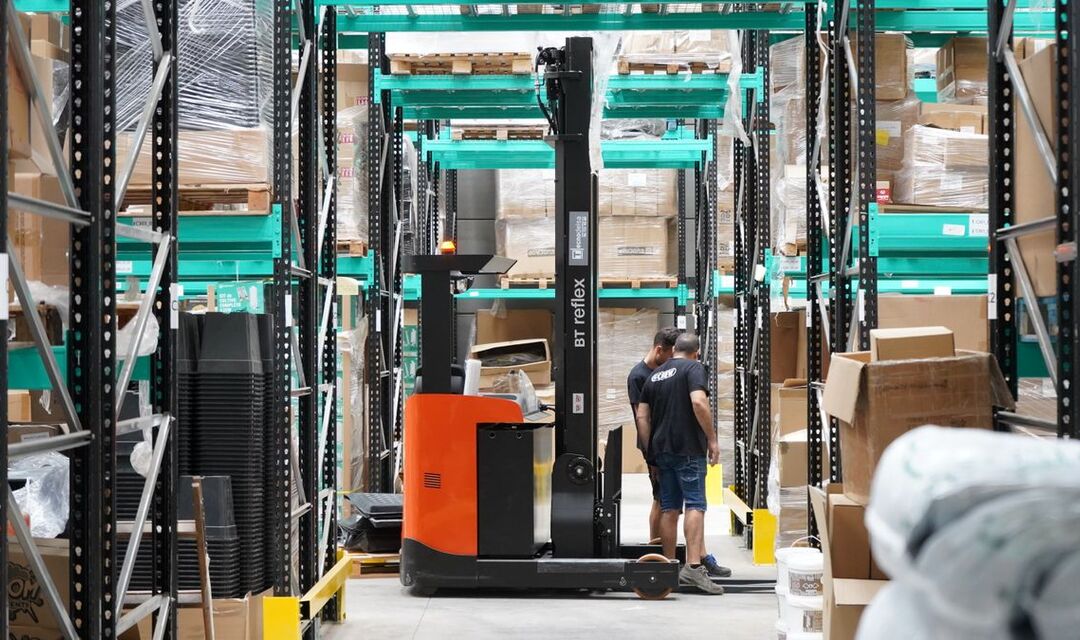
Inventory analytics, shipment monitoring, loading-dock intelligence, and operational performance tools.

Occupancy insights, guest-service analytics, facility monitoring, and energy intelligence.

Campus safety monitoring, building utilization, maintenance insights, and integrated facility dashboards.

Video analytics, unified alarm monitoring, event correlation, and command-center applications.
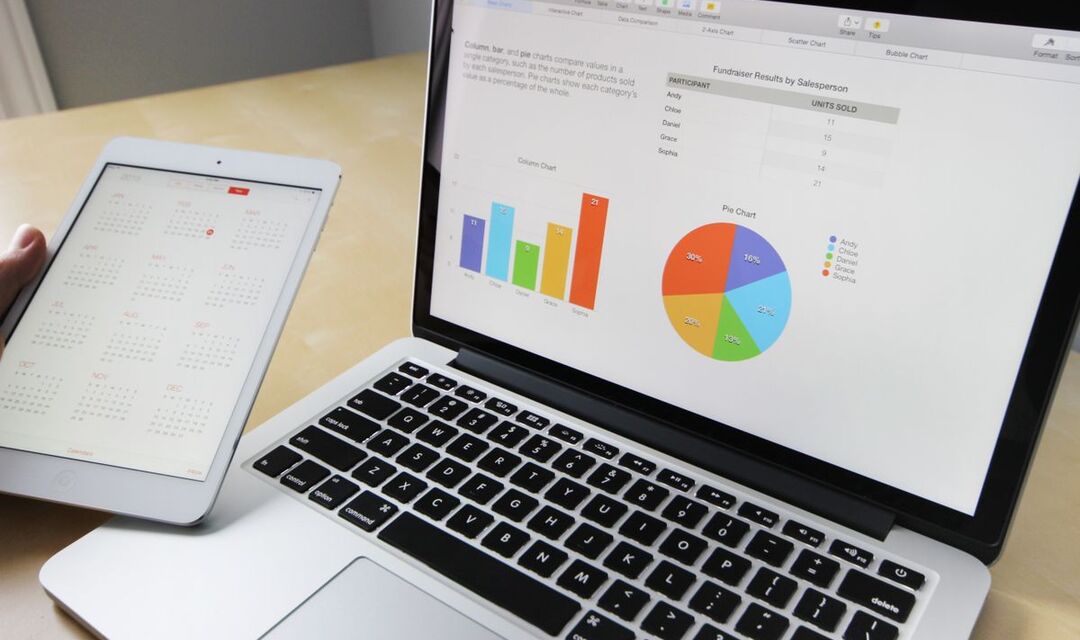
Executive dashboards, workflow automation, demand forecasting, and cross-system business intelligence.
Most teams spend hours each week pulling numbers out of separate systems to build reports. We connect those sources into one dashboard that updates itself, shows what changed and why, forecasts what is likely next, and flags what needs attention. Each one is designed around the decisions your team makes every day.
Press 4 vibration trending above normal
Maintenance check recommended within 48 hours.
Line 4 changeovers take 22 minutes longer
Standardizing the setup could recover about 3 hours a week.
Weekly production report sent
Delivered to plant leadership every Monday at 7:00.
Example data for demonstration only.
Spreadsheets, databases, ERP, sensors, and cameras feed one view.
See what changed, and what is likely to happen next.
Unusual readings are flagged to the right person early.
Weekly summaries are written and sent without manual work.
Our engineering-led approach helps identify where AI could improve productivity, product and service quality, audits, security, or business performance.
Share a business problem, desired outcome, or opportunity.
Review processes, systems, data readiness, and potential value.
Shape the product concept, dashboard, model, or pilot.
Develop, integrate, test, and evaluate against agreed goals.